[ad_1]
Coinspeaker
Ethereum Could Drop to $1200 by December before Rallying, Says Analyst
Ethereum
ETH
$2 352
24h volatility:
0.7%
Market cap:
$283.06 B
Vol. 24h:
$12.70 B
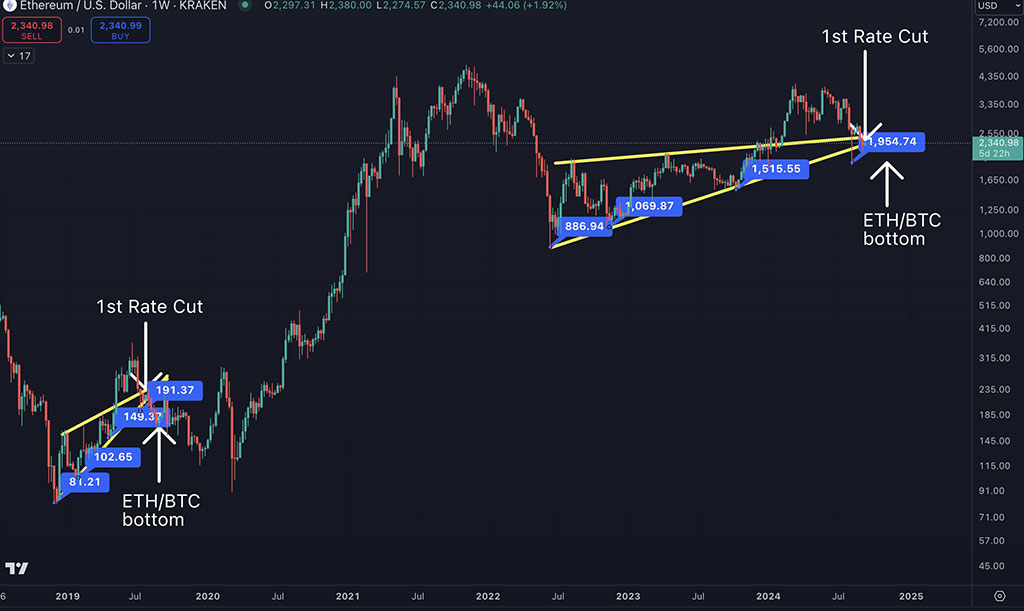
, the second-largest cryptocurrency by market cap, saw a relief rally early this week, up 2% and traded at $2.3k at press time. This was contrary to last week’s 5% losses that pushed the altcoin to a low of $2.1k. Despite the slight rebound, crypto analyst Benjamin Cowen projected a likely plunge below $1500, citing a similar 2019 pattern.
“In 2019, ETH fell back into its wedge right before the 1st rate cut, just like 2024. After the first rate cut in 2019, ETH fell below its wedge, and then ETH/BTC finally bottomed,” noted Cowen.

Photo: Benjamin Cowen / X
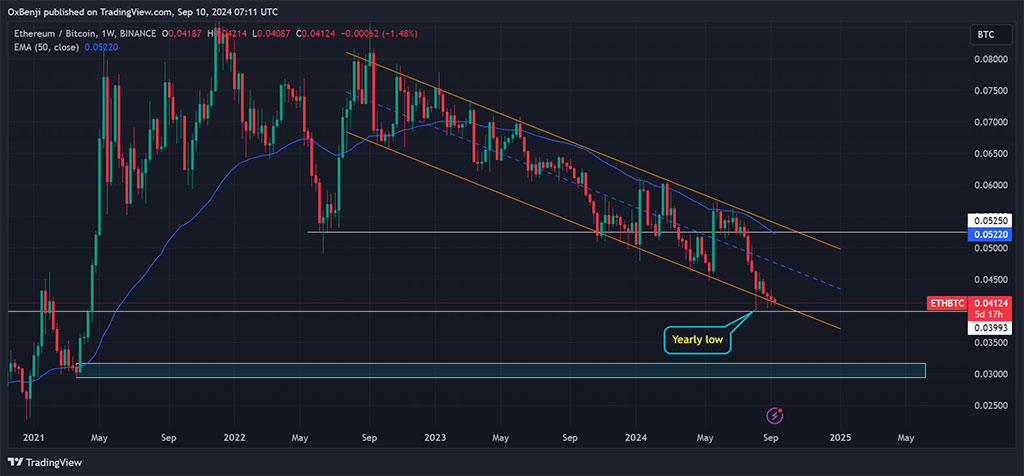
The markets expect the first Fed rate cut during next week’s FOMC (Federal Open Market Committee) meeting. In 2019, ETH slipped below the wedge pattern after the first rate cut, triggering an ETH/BTC bottom. For context, the ETH/BTC ratio tracks ETH’s value relative to BTC
BTC
$56 911
24h volatility:
0.2%
Market cap:
$1.12 T
Vol. 24h:
$30.22 B
and recently hit a yearly low of 0.40.
According to Cowen, if the 2019 pattern plays out, ETH/BTC could bottom out when ETH hits $1200 by December 2024 before picking up momentum in H1 2025. Currently, the ETHBTC ratio has struggled to hold at the range-low of its two-year-long channel.

ETH/BTC ratio. Photo: TradingView
Quinn Thompson of crypto hedge fund Lekker Capital recently echoed the same sentiment. He argued that the ETH/BTC ratio could drop to 0.033 by the end of the year before reversing, claiming that ETH was overvalued at current prices. Based on the current BTC’s $56K value, that would translate to $1800 for ETH.
ETH Demand Woes
Part of the ETH price underperformance relative to BTC has been linked to the lackluster results from US spot ETFs. Since the products began trading in July, they have recorded cumulative outflows of $574 million per Farside Investors data. In fact, the products recorded zero flows during some trading days in the past two weeks.
On the contrary, US spot BTC ETFs netted $16.9 billion in total inflows since their debut and performed even better during the first two months.

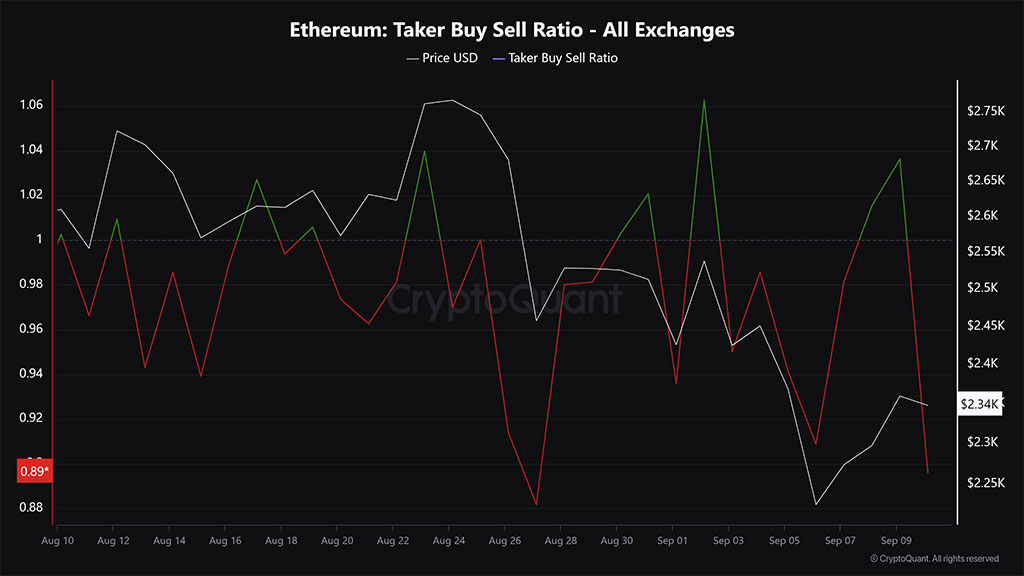
Photo: CryptoQuant
However, bearish sentiment remained dominant among ETH speculators despite this week’s relief rally. According to the negative reading (red position) on the Taker Buyer Sell Ratio metric, sell volumes outpaced buy volumes. This illustrated that bearish sentiment prevailed in the derivatives market.

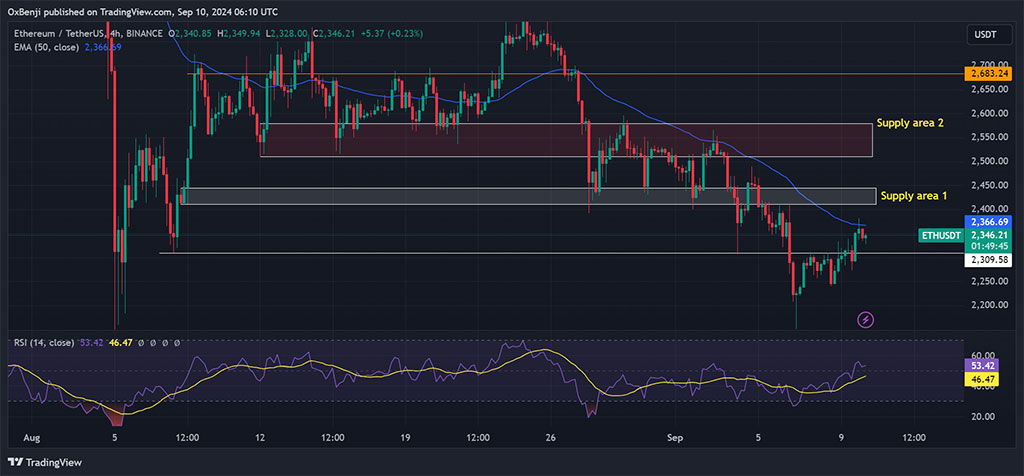
Photo: TradingView
So, in the short term, the key supply levels to watch out for were the 50-day EMA (Exponential Moving Average) of $2.3K, $2.4K, and $2.5K.
Ethereum Could Drop to $1200 by December before Rallying, Says Analyst
[ad_2]
Source link


