[ad_1]
On-chain data shows the average Ethereum transaction fees have seen a sharp drop after hitting 11-month highs just last week.
Ethereum Transfer Fees Has Declined By Around 35% In Past Week
According to data from the on-chain analytics firm Santiment, the fees hit very high values when the asset’s price plunged below the $2,000 level about a week ago.
The indicator of interest here is the “average fees,” which, as its name already implies, measures the average amount of fees (in USD) that investors are attaching to their transactions right now. This metric’s value is mainly affected by the density of traffic that the Ethereum network is receiving currently.
When a large number of transactions are taking place at once, the mempool (the place where transfers wait to be added to the block) may get congested. During such times, a lot of transfers can get stuck in waiting as the network validators naturally prioritize transactions carrying high fees.
Investors that want to get their transfers through faster then begin to attach a higher amount of fees with them. Other holders may then also try to outcompete these high fees transactions by attaching even larger amounts, and so, in this way, the average fees can quickly blow up.
This is only true when the mempool is congested because when the blockchain is receiving little traffic, there isn’t much incentive for investors to attach any significant amount of fees since the network has enough capacity to handle all sorts of transactions quickly enough.
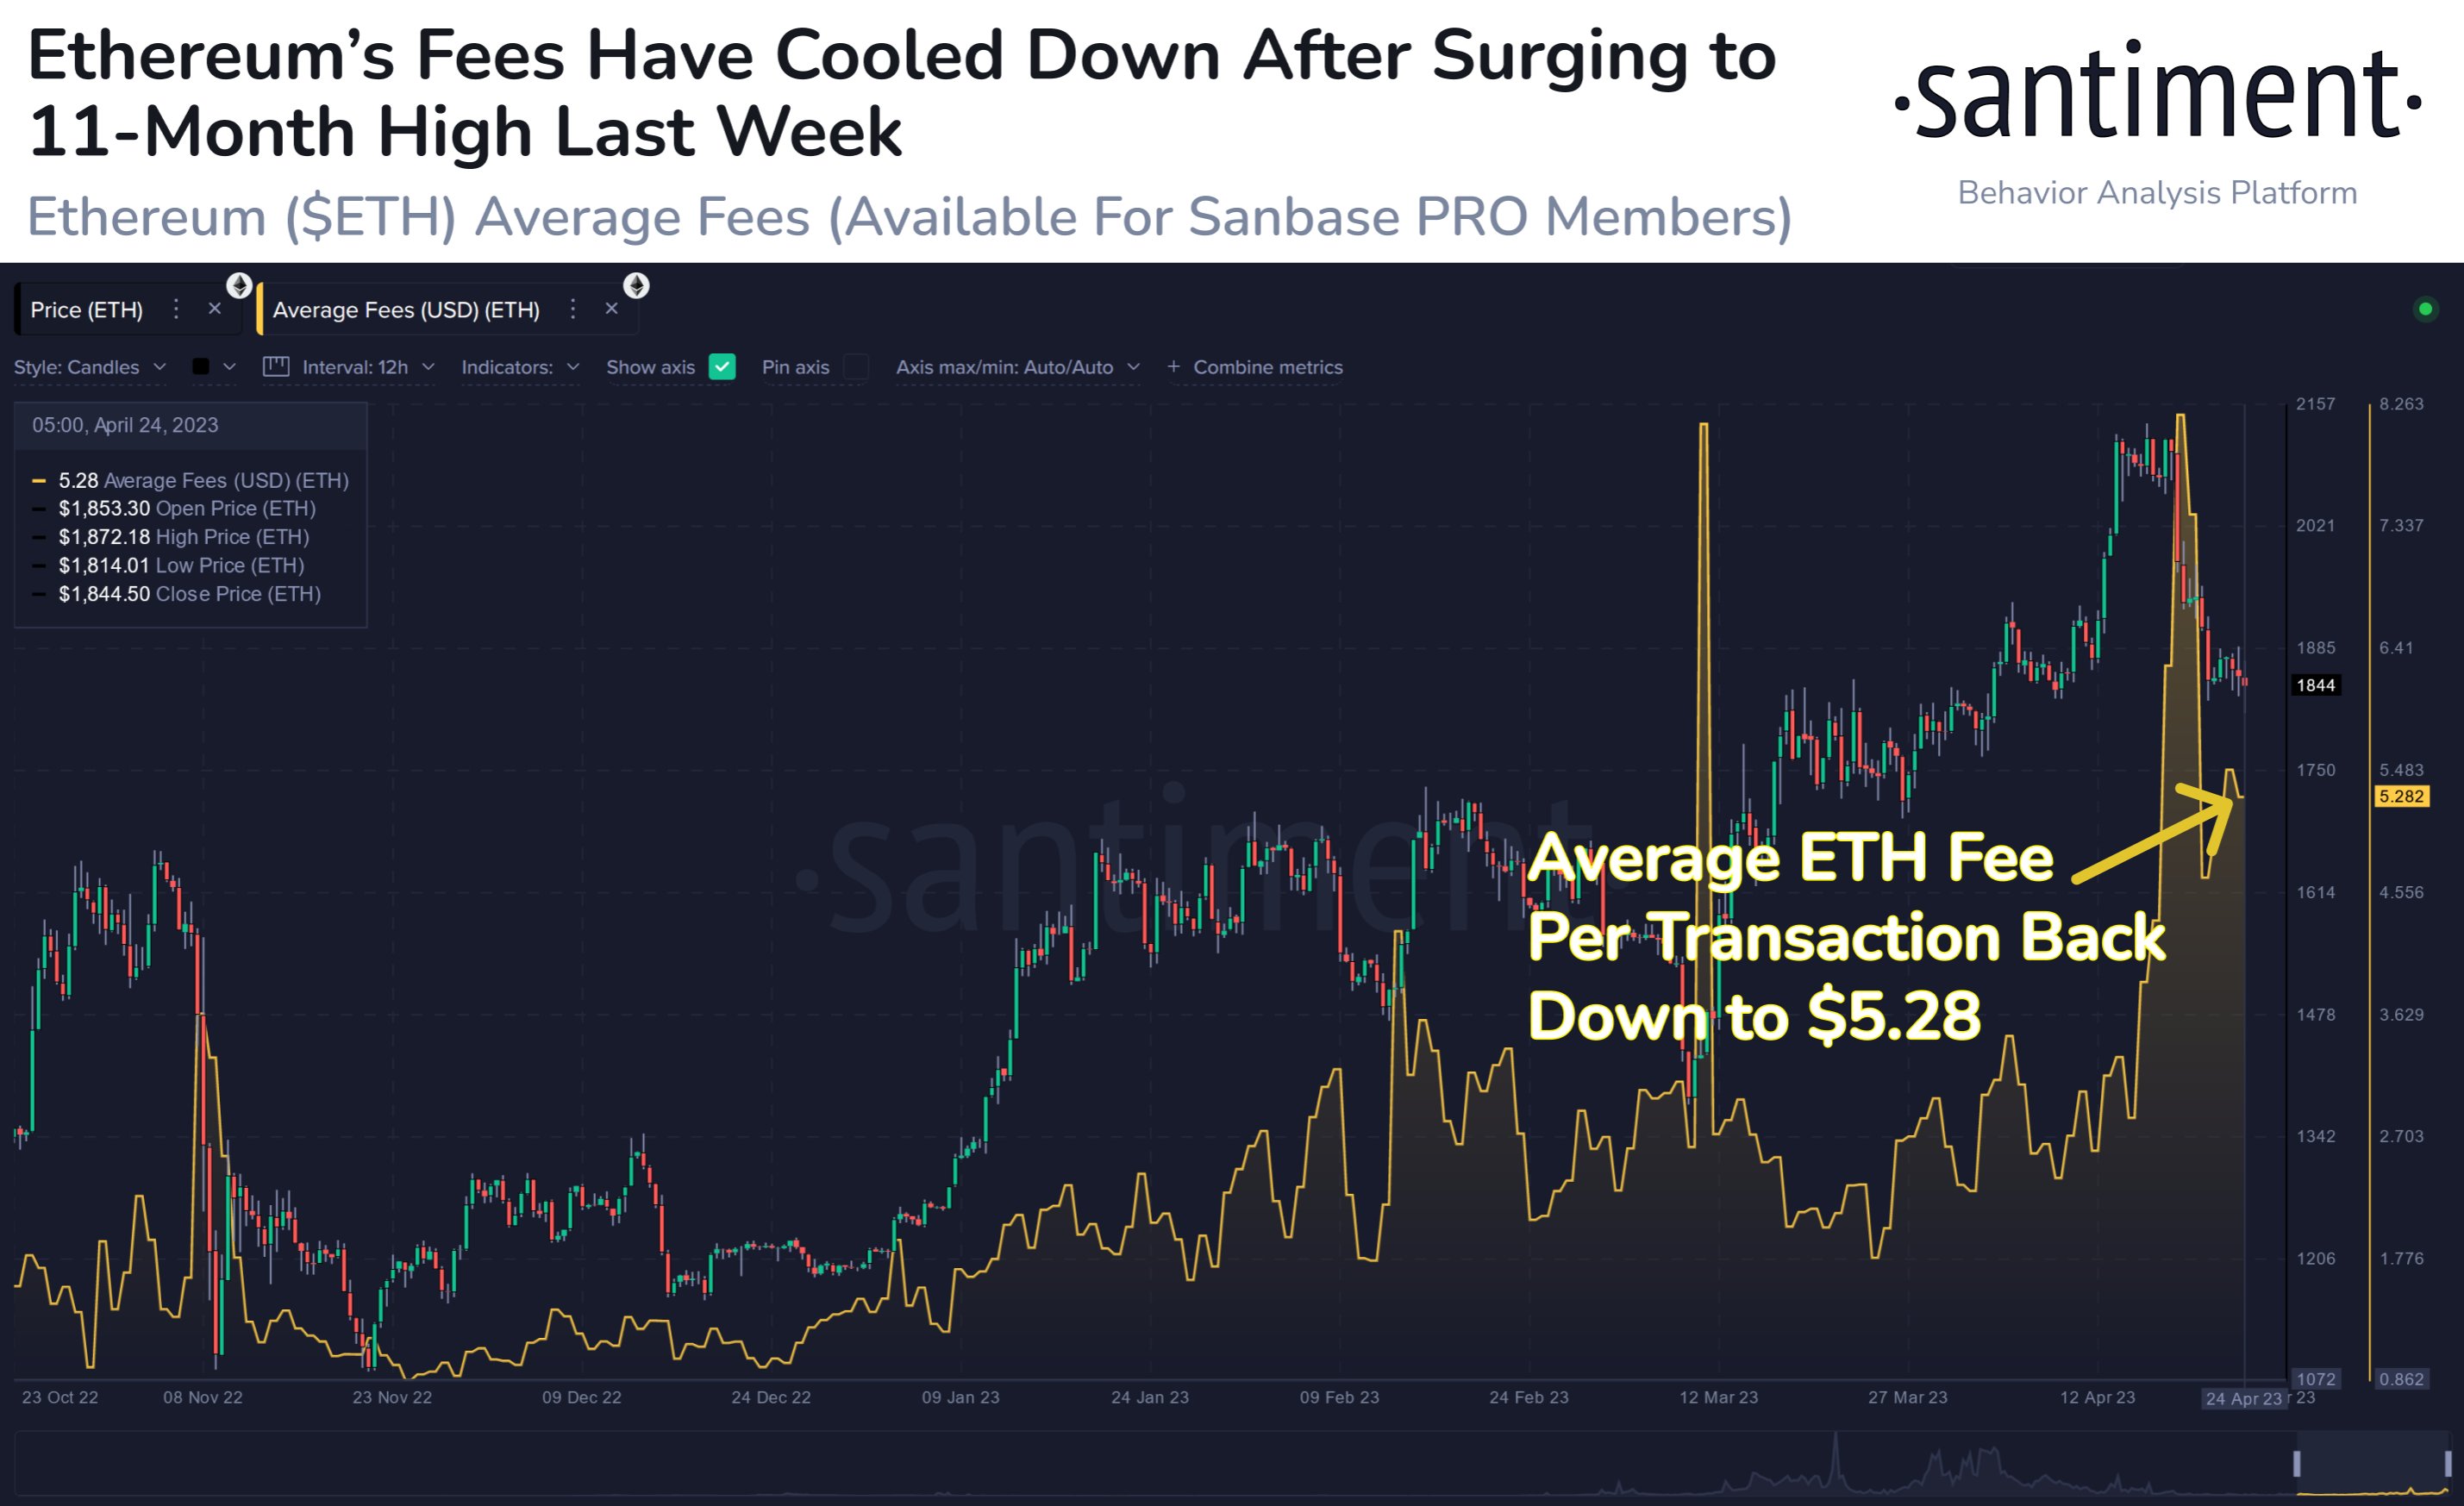
Now, here is a chart that shows the trend in the Ethereum average fees over the past few months:
Looks like the value of the metric has been elevated in the last few days | Source: Santiment on Twitter
As shown in the above graph, the Ethereum average fees surged to pretty high values around a week ago, when the price of the asset had started sliding off below the $2,000 mark.
It’s not uncommon to see the fees exploding during such volatile price action, as investors usually rush to make their moves (whether for buying or selling) whenever the market behaves like this, thus congesting the mempool.
The spike this time was quite extraordinary, however, as the average fees surpassed even that observed during the crash following the collapse of the cryptocurrency exchange FTX back in November 2022.
As Ethereum’s drawdown has slowed down in the last few days, the indicator’s value has also sharply dropped off from its 11-month high. Now, the metric’s value has hit just $5.28, which is about 35% less than what was seen last week.
This rapid plunge in the average fees suggests that the demand for transacting on the ETH network has severely dropped in the past week. Though, while the blockchain activity may be low relative to last week, the current values of the indicator are nonetheless still quite significant.
ETH Price
At the time of writing, Ethereum is trading around $1,800, down 14% in the last week.
ETH has taken a plunge in recent days | Source: ETHUSD on TradingView
Featured image from Michael Förtsch on Unsplash.com, charts from TradingView.com, Santiment.net
[ad_2]
Source link


